

Key Takeaways
- US travel demand cooled as TSA volumes slipped below prior-year levels after tariffs
- Ad budgets flattened in the US caused by weaker travel
- Budgets grew on key performance platforms like Social and Digital Video
- Modest ad spend growth is expected in Q4 as travel demand weakens
Rolling 12-week TSA throughput pointed to a steady cooling in traveler volumes through 2024. Passenger counts that were running 15–17 million above prior-year levels in early 2024 narrowed to only a few million by the fall. The pullback reflected consumer caution amid inflation, tighter household budgets, and rising costs, with travelers becoming more selective about destinations and expenditures ahead of key holiday travel time periods.
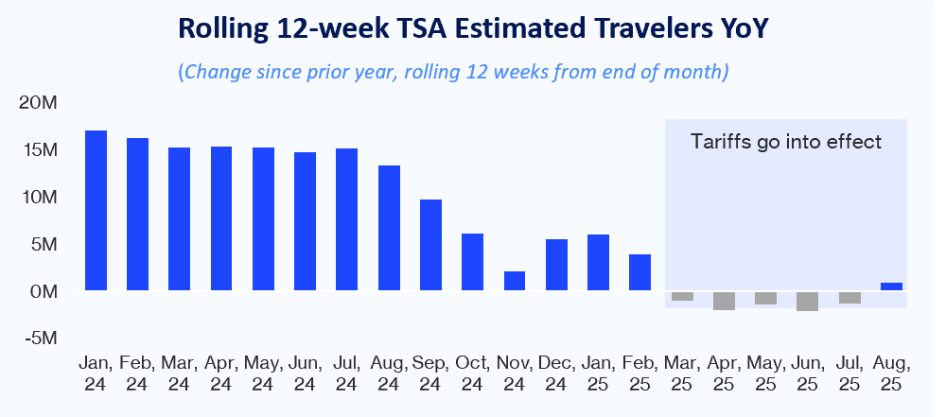
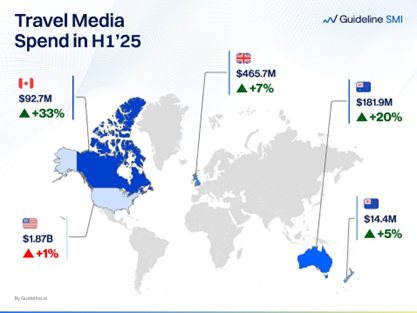
The slowdown accelerated once tariffs took effect in early 2025. Rolling 12-week volumes slipped below prior-year levels by February–March 2025 and remained in contraction through mid-year. While Travel Services ad spend held up longer, the gap between media investment and underlying demand widened materially after tariffs were introduced. The international comparison underscored the U.S.-specific nature of this downturn: Canada advanced +33% YoY, Australia +20% YoY, the UK +7% YoY, and New Zealand +5% YoY in H1’25, while the U.S. rose only +1% YoY. Robust growth elsewhere suggests that global travel appetite remains intact; the sharp U.S. decline reflects changes in domestic policy and economic headwinds, with tariffs serving as the key inflection point.
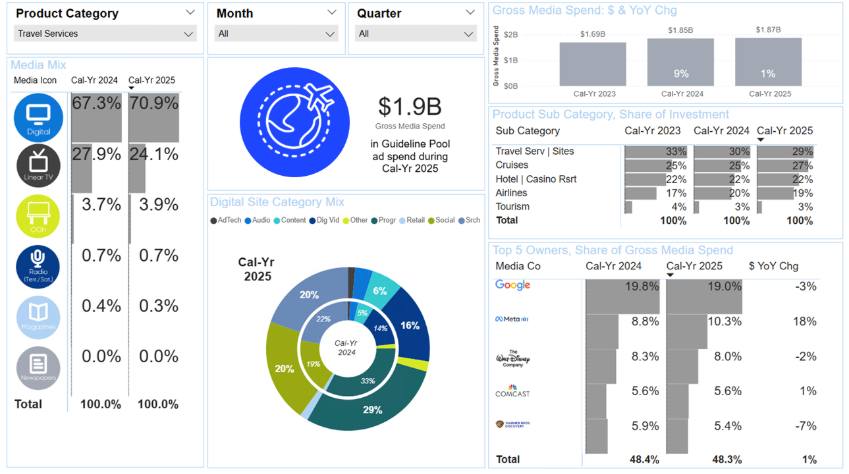
Travel Services media spend edged up +1% YoY in the first half of 2025, slowing from +9% YoY growth in the same period last year.
The category is split across five segments: Travel Services & Websites (29% share of wallet), Cruise Lines (27%), Hotels & Casino Resorts (22%), Airlines (19%), and Tourism Bureaus (3%). Hotels & Casino Resorts (+2% YoY) and Cruise Lines (+6% YoY) posted gains, while the remaining sectors contracted.
Digital spend extended its growth streak, but Linear TV reversed to a -13% YoY decline after a +2% YoY gain last year. Programmatic and Search both slipped into single-digit declines from last year’s double-digit increases, with budgets shifting primarily into Social and Digital Video.
Among Media Owners, revenue for the Top 5 rose +1% YoY in H1 2025. Meta stood out with an +18% YoY surge, while other major players were broadly flat.
Q4 Outlook: Seasonal Increases Likely Muted by Declining Travelers
Historically, Q4 is typically 27% of travel spend, with large campaigns ahead of popular holiday travel. However, in Q2 earnings calls Marriot, Hilton, Hyatt, Choice Hotels, MGM, Expedia, and Host Hotels noted a more modest outlook for Q4 as business and luxury travel sectors remained positive while remaining business units were seeing softness. Given broader economic and political headwinds in connection with moderated outlooks from the hospitality sector, the Q4 outlook is as follows:
Expected flat to modest growth in ad spend with digital leading growth. Continued declines in print, television, following trends from H1’25
Shifts to promotion, value companies to boost spend in non-luxury travel
Refocus on domestic travel locations as international travel waned in H1’25
Want a Deeper Read on how Travel Demand is Shifting?
The trends emerging in 2024–2025 are more than seasonal noise—they represent a structural reset in how U.S. travelers plan, spend, and respond to economic pressure. From weakening TSA throughput to the divergence between U.S. and international markets, the cracks forming now will shape how brands plan Q4 and enter 2026.
Guideline’s latest Travel Services Category Spotlight provides a comprehensive, data-backed view of these dynamics—covering demand signals, media investment shifts, platform performance, and forward-looking projections across every major travel segment. Download the full report to explore the complete insights and uncover the signals shaping the next phase of travel. Empower your 2025–2026 strategy with Guideline intelligence.