Key Takeaways

  • U.S. media spend contracted -3% YoY, marking the second straight monthly drop
  • Excluding the absence of Olympic dollars, August spend posted a modest +4% YoY increase
  • Digital rose +8% YoY, while Traditional media plunged -29% YoY
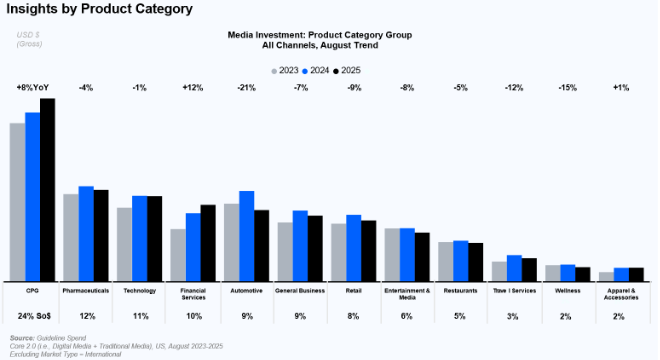
  • Automotive spend fell -21% YoY and Retail declined -9% YoY, reflecting cost pressures from higher import tariffs

US media spend in August reflected not only the absence of Olympic dollars but also broader macroeconomic and policy pressures. The Trump administration’s reciprocal tariffs, which took effect early in the month, raised import costs and squeezed margins across automotive and retail, prompting budget pullbacks. Inflationary pressures and supply-side constraints kept effective media rates elevated, adding further strain. While Digital channels such as Social and Search continued to absorb demand, Traditional media came under increasing pressure. Together, these forces fostered advertiser caution, leading brands to reallocate budgets toward more efficient, performance-driven channels and away from large, discretionary campaigns.

August 25 US All Media Brief 100225 2
U.S. media spend declined –3% YoY in August 2025, reversing the strong +13% YoY gains seen in 2024 and falling behind +4% YoY growth in 2023. The drop reflects the absence of Olympic spend as well as renewed pressure from tariffs and broader macroeconomic headwinds. Source: Guideline Spend – Core 2.0 (Digital Media + Traditional Media), U.S., August 2023–2025.

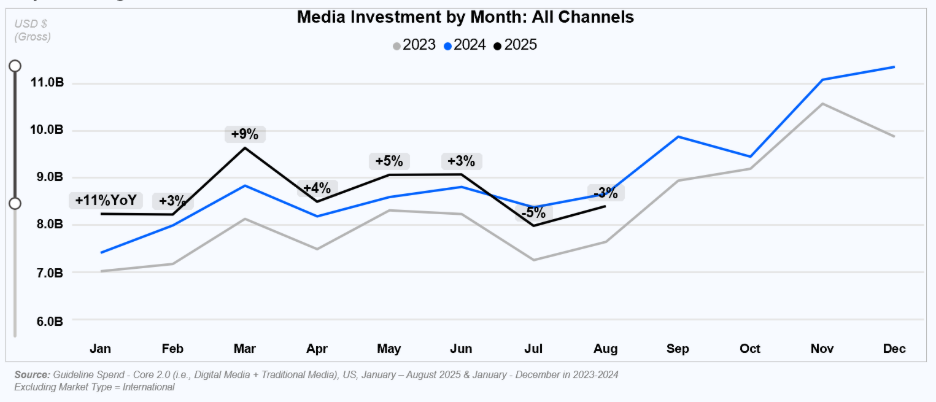
US media spend declined -3% YoY in August 2025, marking a second straight monthly drop and reversing the +13% YoY gain seen in the same month last year. The absence of Summer Olympics advertising weighed heavily on results. Excluding the Olympic effect, August total spend rose a modest +4% YoY, but including it, overall spend fell -3% YoY.

A graph with a line and a blue lineAI-generated content may be incorrect.
Media investment trends show a volatile 2025, with strong early-year gains offset by mid-year declines and a muted August recovery. While 2024 maintained steady growth and 2023 trailed behind, 2025 reflects sharper reactions to economic pressures, tariff impacts, and shifting advertiser priorities — highlighting the importance of real-time pacing signals for Q4 planning. Source: Guideline Spend – Core 2.0 (Digital Media + Traditional Media), US, January–August 2025 & January–December in 2023–2024. Excluding Market Type = International.

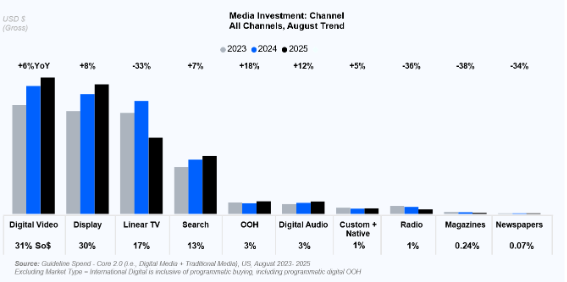
Digital remained resilient but showed signs of cooling, growing +8% YoY in August 2025 compared to +16% YoY in August 2024. Growth persisted across all major formats— Digital Video climbed +6% YoY, Display +8% YoY, and Search +7% YoY—but each slowed from the double-digit gains of last summer.

Traditional media endured a steeper pullback, dropping -29% YoY from the +8% YoY increase recorded last August. Linear TV led the decline, tumbling -33% YoY after +12% YoY growth a year ago. Excluding the Olympic effect, August Linear TV spend declined -17% YoY. Out of Home stood as the lone exception, up +19% YoY.

A graph of a graph of the company's revenueAI-generated content may be incorrect.
Digital Video (+6% YoY), Display (+8% YoY), and Search (+7% YoY) continued to lead channel growth in August, while Linear TV fell sharply at –33% YoY. OOH (+18% YoY) and Digital Audio (+12% YoY) also posted solid gains, underscoring a broader shift toward performance-driven and high-efficiency formats. Source: Guideline Spend – Core 2.0 (Digital Media + Traditional Media), US, August 2023–2025.

Most Product Category Group reduced their media investments in August, though CPG, Financial Services, and Apparel & Accessories managed to post.

A graph of a bar graphAI-generated content may be incorrect.
Category trends in August show mixed momentum across the U.S. ad market: CPG led with +8% YoY growth, while Pharmaceuticals (–4%), Technology (–1%), and Automotive (–21%) pulled back amid rising cost pressures. Retail (–7%), Entertainment & Media (–9%), and Travel Services (–5%) also contracted, reflecting broader advertiser caution. Source: Guideline Spend – Core 2.0 (Digital Media + Traditional Media), US, August 2023–2025. Excludes International Market Type.

On a year-to-date basis through August, US media spend was up+ 3% YoY, slowing down from +17% YoY pace over the same period in 2024.

Share

Related Articles

Guideline swish logo in dark blue centered on a white background
Press Releases
October 8, 2025

Guideline Unveils AI Agent: Accelerating Insight into the Industry’s Most Powerful Media Intelligence Data

Read More
A pendelum on a dark gray sky background that features the Canadian flag as well as the United States of America flag
Insights
October 17, 2025

Canadian Media Spend Tightened as Trade Tensions Rose and Olympics Momentum Faded in August 2025

Read More
Two Toned Light Blue Bars with arrows coming from them; white arrow pointing up for digital, white arrow staying steady over TV, in white block letters it reads: "ad planning has quietly split into two speeds"
Insights
November 7, 2025

The Two-Speed Marketplace: How Digital and TV Planning Are Moving in Opposite Directions

Read More

Start Your
Guideline Journey

Request a demo now and discover how our platform can transform your media planning process.

Book a Demo